1 About UbiBrowser 2.0
Ubiquitination is crucial to protein degradation, transcriptional regulation and cellular signaling in eukaryotic cells. The degree of protein ubiquitination is specifically regulated by ubiquitination through the E1-E2-E3 cascade and deubiquitination through DUB. UbiBrowser 2.0, an update for UbiBrowser, is a comprehensive database of known and predicted eukaryotic E3/DUB - substrate interactions, which is based on a naïve Bayesian classifier and combines various types of heterogeneous biological evidence. It currently contains 4068 known E3-substrate interactions in 38 organisms, 967 known DUB-substrate interactions in 8 organisms, and 1,884,676/303,214 predicted high confidence E3/DUB-substrate interactions in 39 eukaryotic species. Totally 360,949 proteins’ corresponding E3 ligases and DUBs of 39 eukaryotic species can be explored.
2 Main functions
UbiBrowser 2.0 is designed to allow users to explorer the reported and predicted E3/DUB-substrate interactions for a query E3/DUB or substrate, and ubiquitination/deubiquitination sites for substrate protein. Three major pages are provided by UbiBrowser 2.0: “network view of the known and predicted E3 ligase/DUB-substrate”, “Supporting literature information of the reported E3 ligase/DUB-substrate” and “Supporting evidences of the predicted E3 ligase/DUB-substrate”.
“Network view of the known and predicted E3 ligase/DUB-substrate” shows both the known and predicted E3/DUB-substrate interactions.
“Supporting literature information of the reported E3 ligase/DUB-substrate” present the supporting literature sentence for E3/DUB-substrate interactions extracted from literatures
“Supporting evidences of the predicted E3 ligase/DUB-substrate” provides the known ubiquitination sites for query protein and predictive E3/DUB recognizing domain/motif.
3 Browser requirements
UbiBrowser 2.0 supports the latest versions of the Chrome, Firefox, Opera, Safari and Internet Explorer (version 10 and 11).
4 Search
4.1 UbiBrowser 2.0 supports three input types.
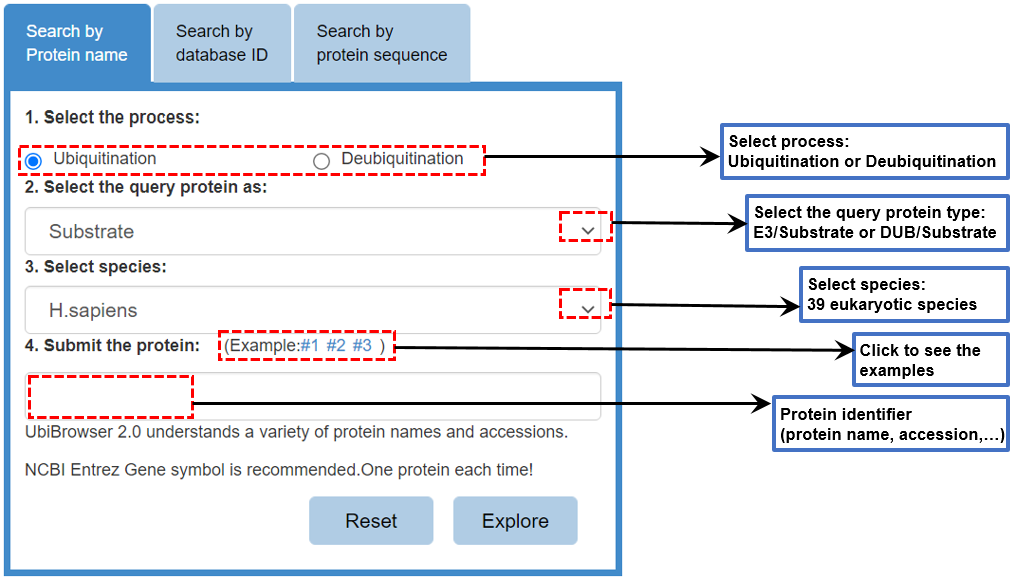
Figure 1 Input form
Please use the input form at the index page to query your protein. Please first specify the prediction process as "ubiquitination" or "deubiquitination", then select whether the searched protein is "DUB", "E3" or "substrate", and then select species and finally submit your query protein. There are three tab controls in the input form and you can query your protein by entering 1) protein name (Entrez gene symbol), 2) protein accession number (UniprotAC/ID or GeneID) or 3) protein sequence.
Attention:only one protein each time.
4.2 Specify the protein
When you search the protein by protein name or sequence, there might be multiple matches, and you should specify the query protein.
When you search the E3/DUB or substrate protein by protein name, all the matched entries will be shown in a table with short descriptions to help you specify your query protein.
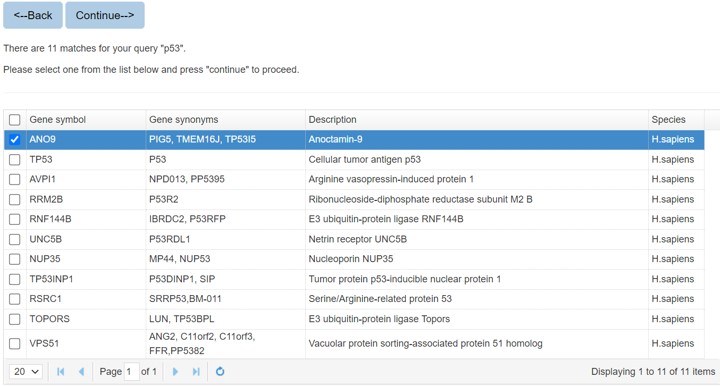
Figure 2. The list of candidate proteins
If you search the protein by protein sequence, the sequence identity score from BLAST will be listed in the parenthesis after the description.
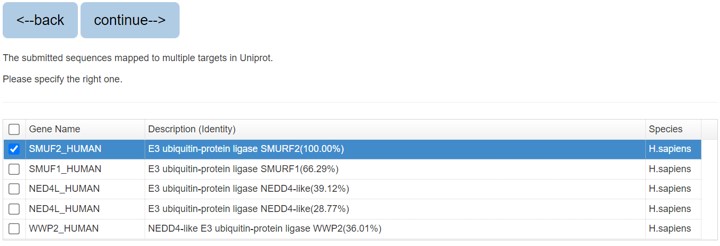
Figure 3. The list of blast result
Please specify the protein and click “continue” for result page.
5 Browse
You can browse the known and predicted interactions of a specified E3 ligase/DUB by selecting attribution (e.g., species, interaction type, E3/DUB family classification) in the taxonomy tree on the left. The known interactions of your specified E3 ligase/DUB is default, you can click the “Predicted substrates” button to view all the predicted substrates and click the “Network view” button for the network view page (where you can download).
6 Network view of the retrieved E3 ligases/DUB-substrate interactions.
Network view of the known and predicted E3 ligases/DUB-substrate interactions is the default view. In this network view, the central node is the query E3/DUB or substrate, and the surrounding nodes are the retrieved substrate or E3/DUB. The known and predicted interactions are obviously distinguished: the nodes of known interactors are painted in red, while the nodes of the predicted interactors in blue. There are three function parts in this view. i): Source selection filter (allow users to select only known interactions or to select only predicted interactions). ii: E3 ligase/DUB filter (providing a more specialized list of E3/DUB according to the user's needs). iii: Homologous mapping (allow users to view the network for the homology of your query protein in other species). Attention: The network view of retrieved results for E3/DUB only shows the known interactions with E3/DUB enzyme family information. Please download all known interactions from the 'Download' page

Figure 4-1. Network view of the known and predicted E3 ligases-substrate

Figure 4-2. Network view of the known and predicted DUB-substrate
6.1 Retrieved E3/DUB-substrate network
This network shows the E3/DUB-substrate interactions for your query E3 ligase/DUB or substrate.
1) querying a substrate (left: both the known and predicted; center: only the known right: only the predicted)
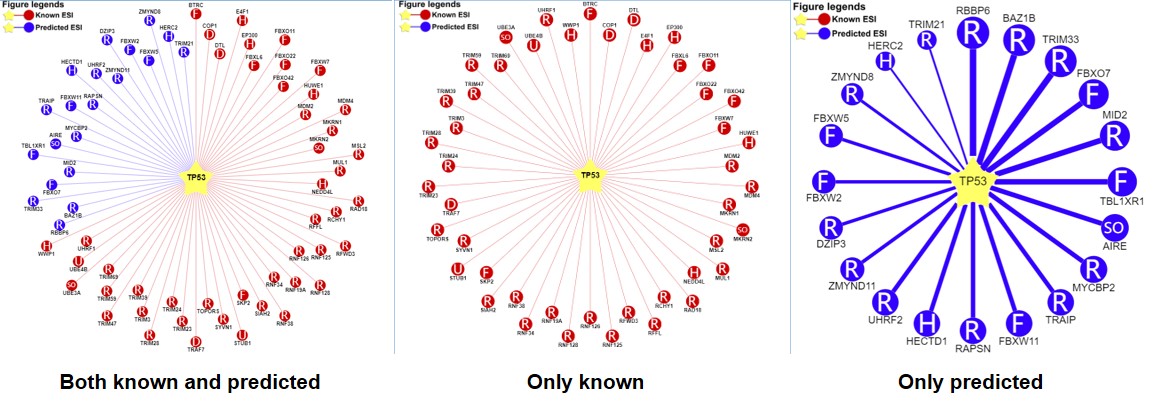
Figure 5-1. Network view for E3-substrate interactions
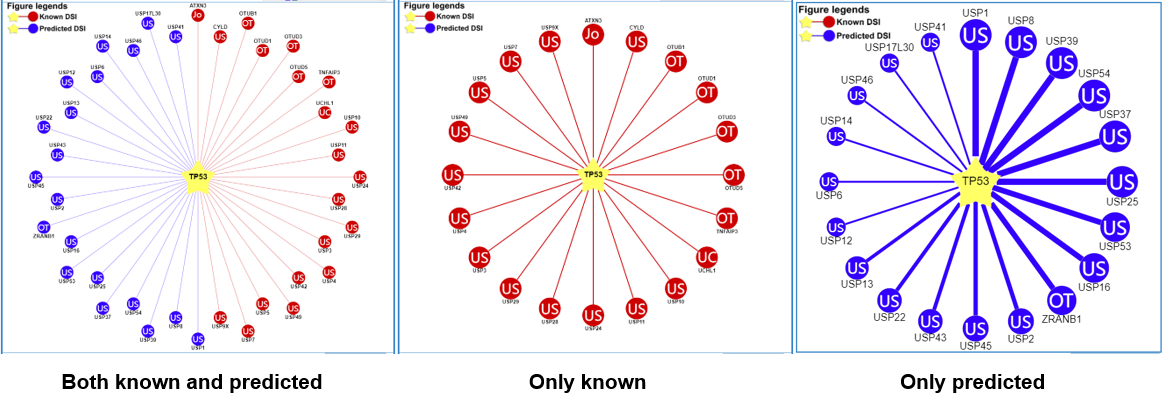
Figure 5-2. Network view for DUB-substrate interactions
Your query substrate locates in the center of the canvas. The predicted E3 ligases/DUB surround the substrate. The node colors reflect sources of interaction: red for the known, and blue for the predicted. The node characters reflect the E3/DUB type. In the network view for the predicted (right), the edge width, the node size are corrected with the confidence score. Node size, edge color depth, and edge width is proportional to the confidence score. clicking the edges to the view of supporting evidences about these E3/DUB-substrate interactions.
2) querying an E3 ligase/DUB (left: both the known and predicted; center: only the known right: only the predicted)

Figure 6-1. Network view for E3 ligases-substrate interactions
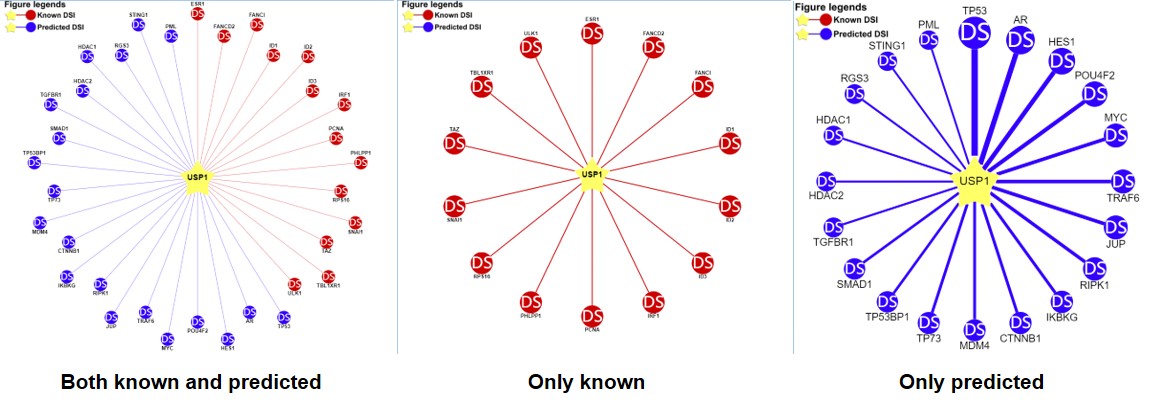
Figure 6-2. Network view for DUB-substrate interactions
Your query E3 ligase/DUB locates in the center of the canvas. The Known and predicted substrates surround the E3/DUB represented by the blue nodes.
Restricted to the canvas size, only top 20 predicted interactions are represented.
6.2 Confidence level assignment
Confidence level assignment for each predicted E3/DUB-substrate interaction
In order to give every predicted E3/DUB-substrate a confidence level, based on the confidence score derived from the naïve Bayesian classifier, we took the following scheme to assign the confidence level for each prediction (to provide accurate clue for each E3/DUB as more as possible).
1. All predicted interactions were sorted in descending order of the confidence score. All the last 99% interactions were classified as “Low Confidence” (These interactions are not displayed in the network view, however they can be downloaded by http://ubibrowser.ncpsb.org.cn/v2/home/download)
2. For the top 1% predictions in UbiBrowser, we assign the confidence level of “High Confidence”.
6.3 Homologous mapping
In order to facilitate users to compare the E3/DUB-substrate interaction information of homologous proteins between different species, 'Homologous panel' is used to view the homologous query protein in other species. Selecting other species in the drop-down box will jump to the E3/DUB-substrate interaction information page of the homologous protein of the retrieved protein in other species.
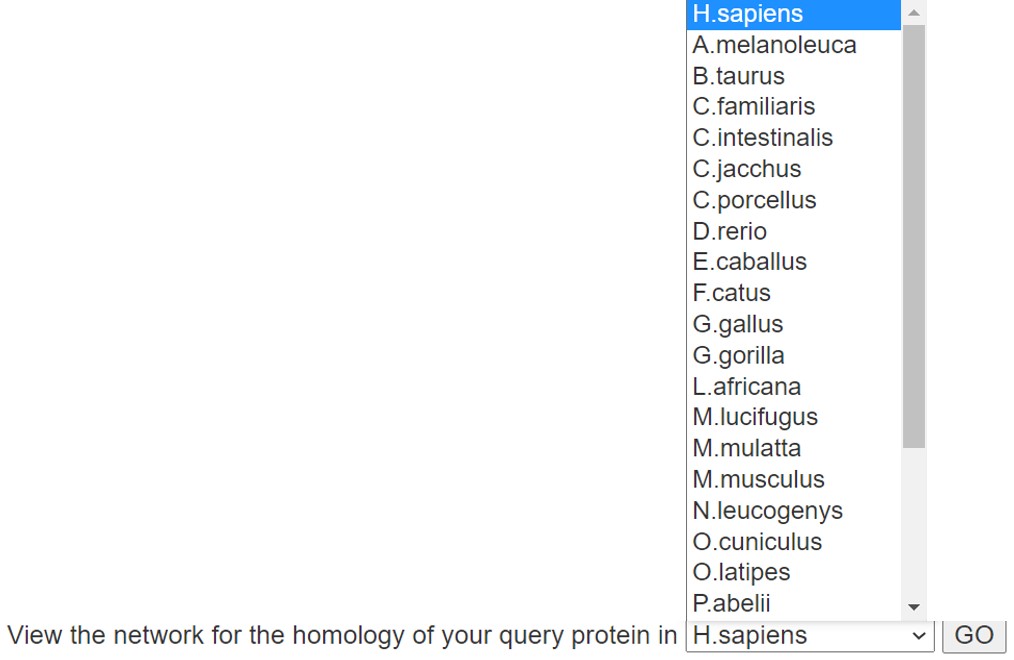
Figure 7. Homologous panel
6.4 Filter
Filter is used to set the confidence range of the shown E3/DUB-substrate in the canvas.
For confidence mode of network view for the predicted, numbers on both sides of the slider are the minimum and maximum value of the confidence score range(Figure 6). You can use your mouse to drag the slider or modification the number in the textbox to change the range. The vertical line locates above the slider denotes the value of confidence scores for the shown E3/DUB-substrate interactions in the network.
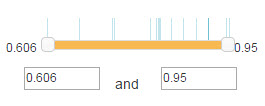
Figure 8. Confidence score filter
For evidence mode of network view for the predicted, you can filter the type of supporting evidence. Lines with different colors represent different supporting evidences. The number in the parentheses counts all the predicted E3/DUB-substrate interactions supported by this evidence. You can select/deselect the check box before each supporting evidences to show/hide E3/DUB-substrate interactions supporting by this evidence.
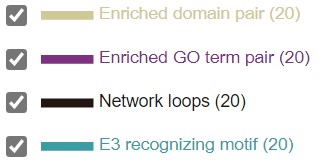
Figure 9. Supporting evidence filter
6.5 E3/DUB hierarchical tree
680 E3 ligases and 72 DUBs are respectively classified into different families. If you query a substrate, the predicted E3s/DUBs and their position in the E3/DUB family hierarchical tree will be presented. In this tree, texts in each circle (just like “F”, “D” and “SO”) represent the E3/DUB family, the same as the text in node of Figure 5. The number in the bracket following each E3/DUB family represents the number of corresponding predicted E3/DUB-substrate interaction and the number following each E3/DUB gene symbol is the related confidence score. You can select/deselect one or more E3/DUB types to show/hide E3/DUB-substrate interactions belong to this E3/DUB type. The “download” button is used to download the prediction score of all the predicted results.
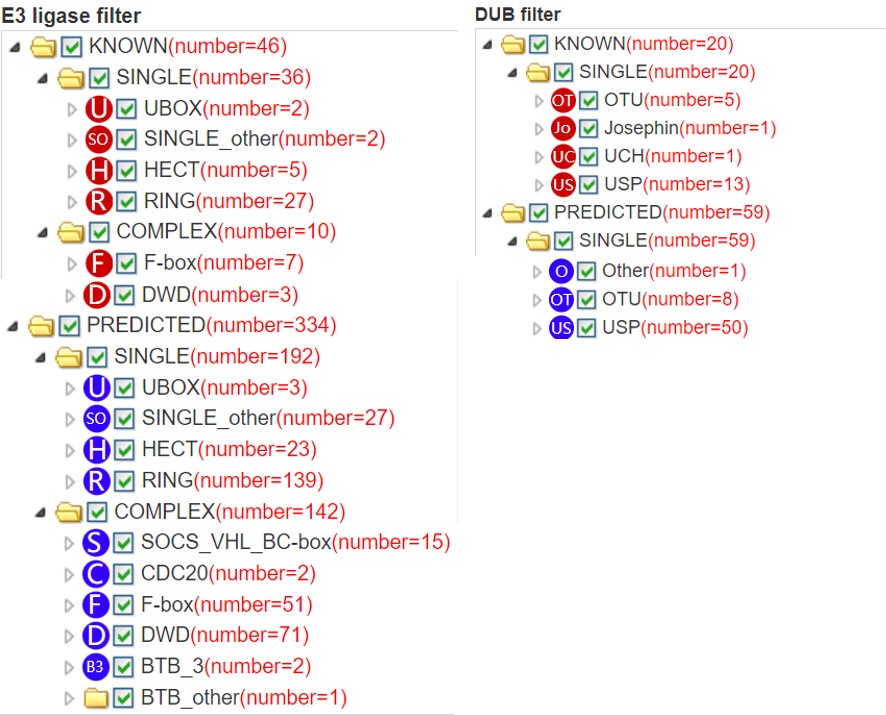
Figure 10. E3/DUB hierarchical tree for substrate
If you query an E3 ligase/DUB, the tree is look like this and just represents the E3/DUB family classification.
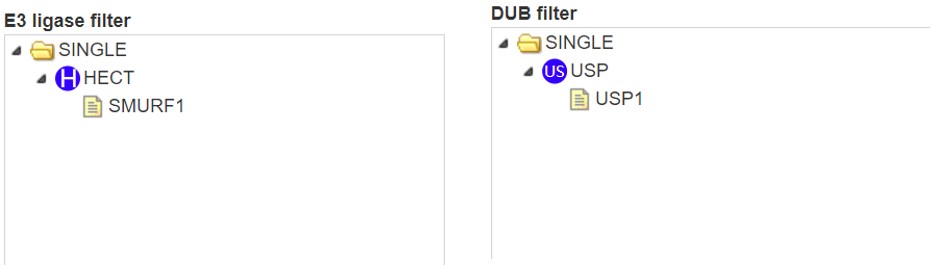
Figure 11. E3/DUB hierarchical tree for E3 ligases/DUBs.
6.6 Network export
If you use Chrome browser, you can export the E3/DUB-substrate network graph by clicking the button “Export network” and the E3/DUB-substrate network graph will be saved as a PNG file. Otherwise, you can capture the E3/DUB-substrate network graph by other screen capture software.
6.7 Prediction summary
Because the E3/DUB-substrate network only show the top 20 predicted interactions. We construct a table to show all the known and predicted results.
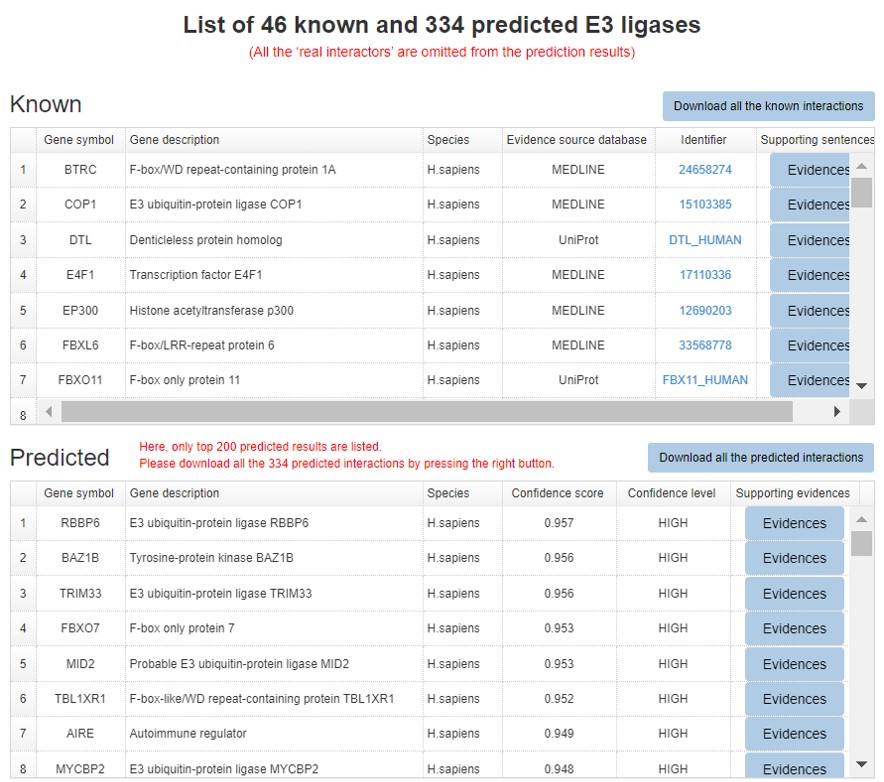
Figure 12. Summary table for the known and predicted interactions
In Figure 14, for evidence mode of network view for the predicted, the gray levels of the dot reflect the predictive confidence from the related single evidence.
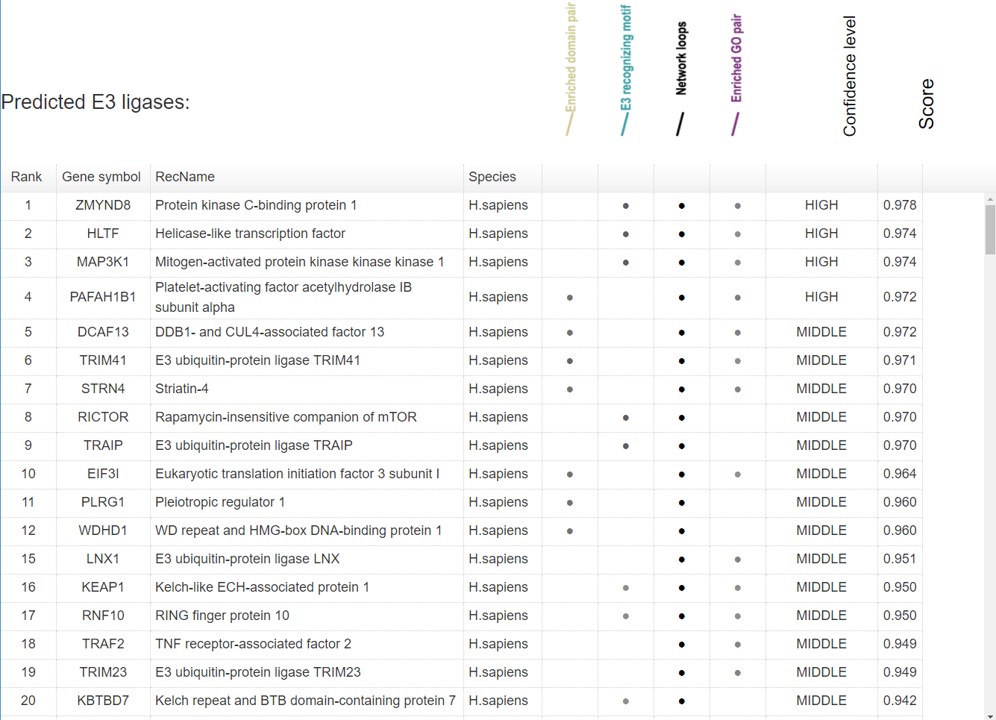
Figure 13. Summary table for evidence model of the predicted interactions
7 Supporting literature information for the known interaction
A brief introduction about E3/DUB and substrate, original literature PubMed ID and the supporting sentence are shown. The entries of E3/DUB and substrate in the supporting sentences were painted in yellow to provide an intuitive user experience. Furthermore, the user can click the hyperlink of PubMed ID to see the original paper.
7.1 Brief information
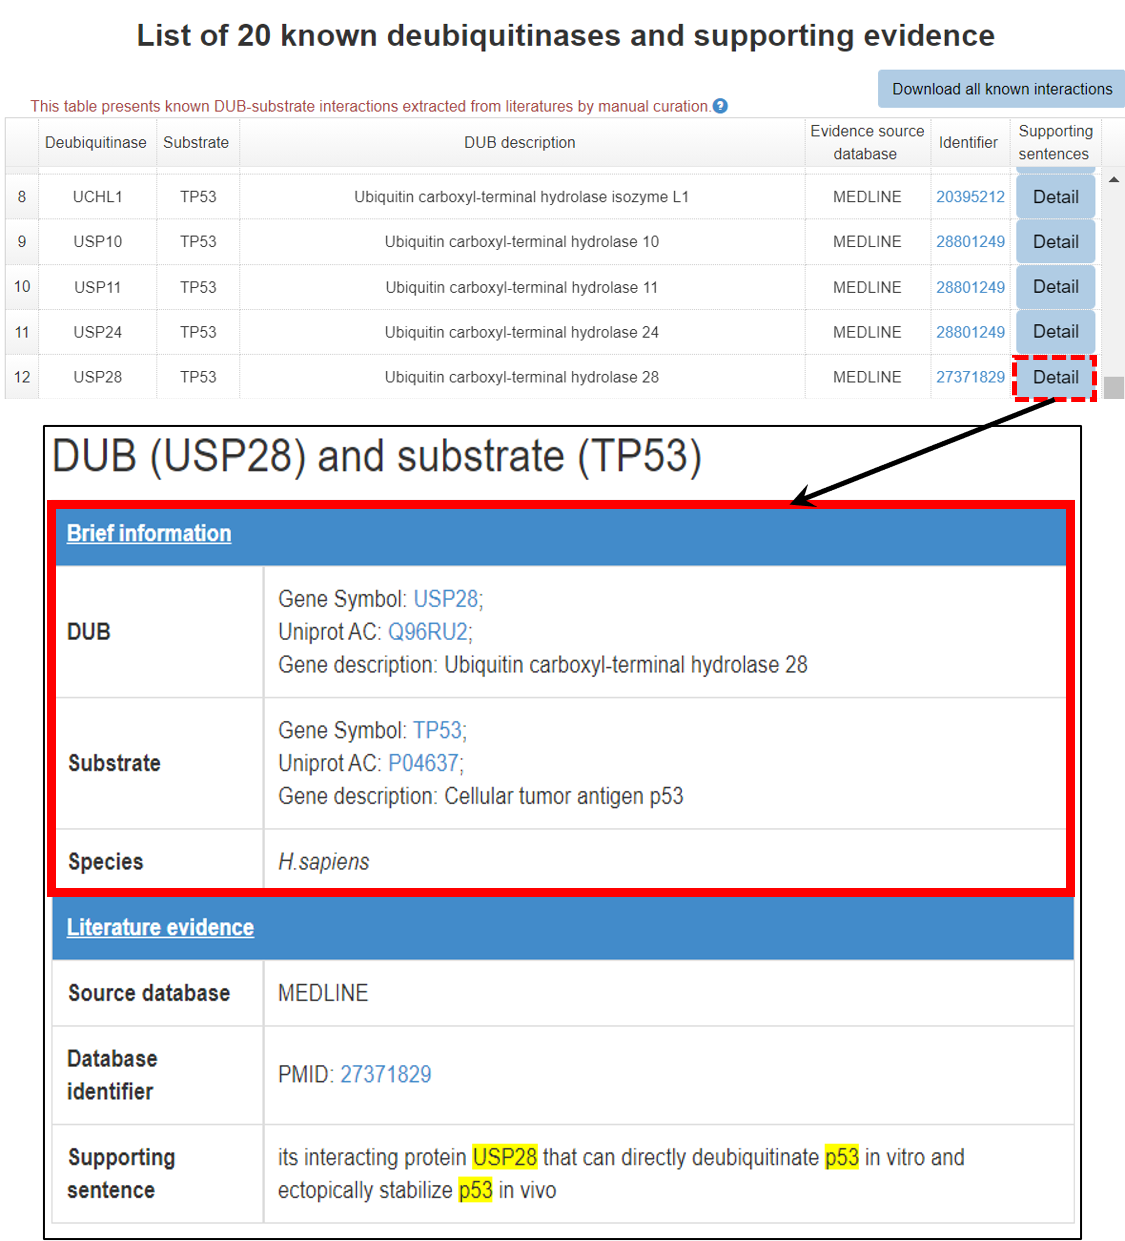
Figure 14-1. Brief information of the literature reported E3/DUB-substrate interaction
7.2 Literature information

Figure 14-2. Literature information of the literature reported E3/DUB-substrate interaction
8 Supporting evidences for the predicted E3/DUB-substrate interaction
When you click the edge in the predicted E3/DUB-substrate network (link) or click the button in the supporting evidence row of summary table(link), a table will be presented to show the pages of supporting evidences for the E3/DUB-substrate interaction.
8.1 Brief information
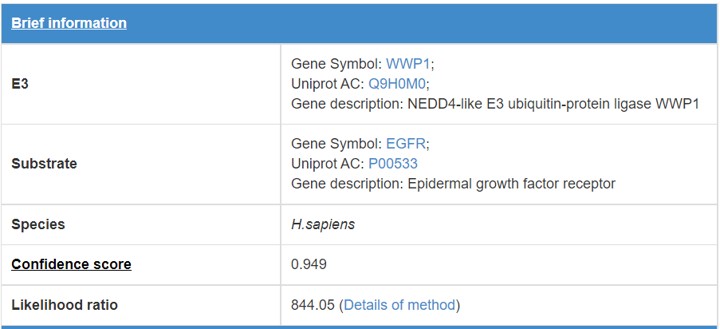
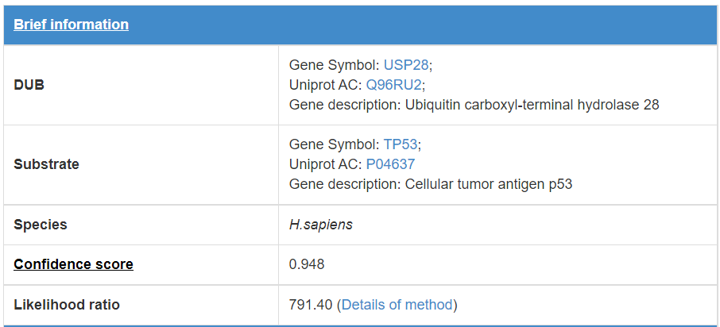
Figure 15. Brief information
*Detail of confidence score. (link)
8.2 Enriched domain pair
We predict the interaction domains between E3/DUB and substrate. This table presents the interaction domain information.
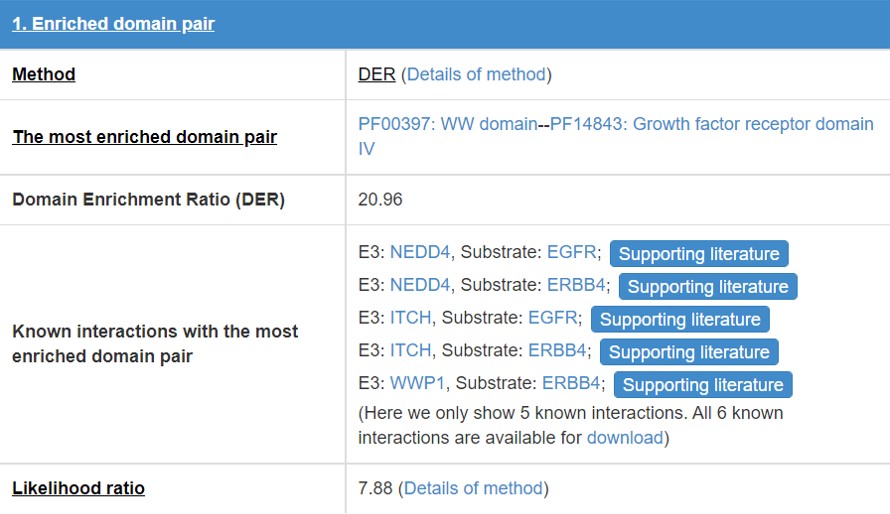
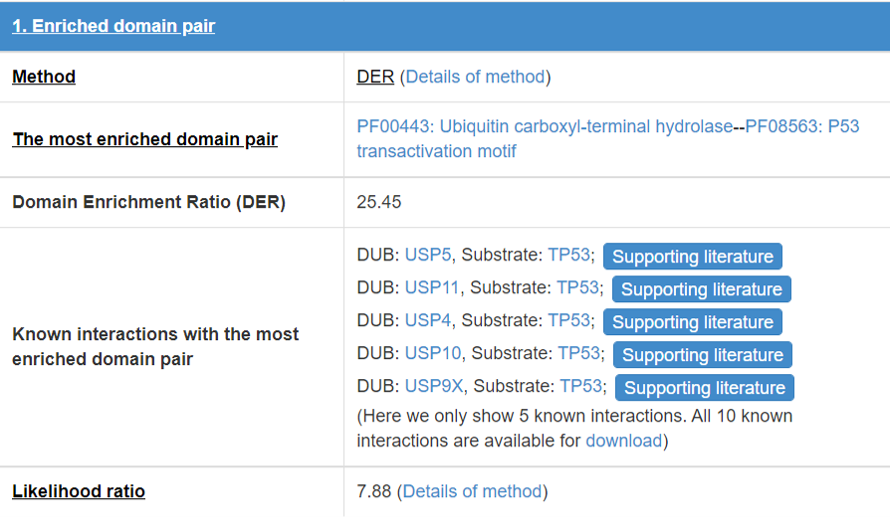
Figure 16 Table for enriched domain pair
Detail of the method of “Enrichment domain pair” and “DER”.
8.3 E3/DUB recognizing motif
E3/DUB may associate with the specific substrate by recognizing a short liner sequence motif, so we extract E3/DUB recognizing motif for E3s/DUBs. The first line of this table list the E3/DUB recognizing motif extract method and you can click the method name to see detail of the method (part 10.7). The second line shows the Motif construction, “.” represent any amino acid. The third line is the likelihood ratio of this evidence.
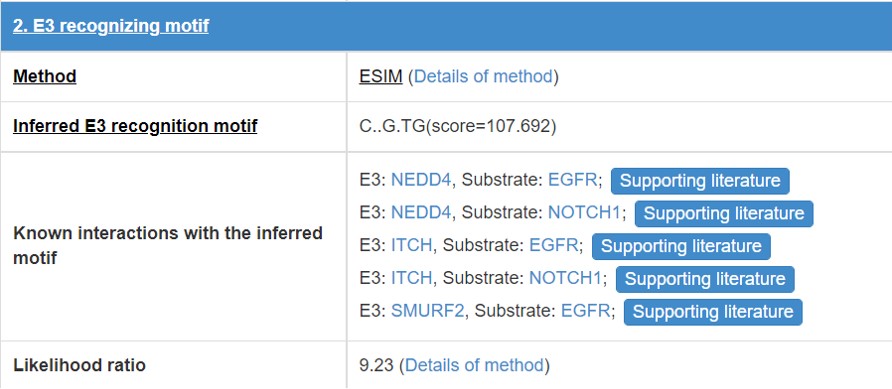
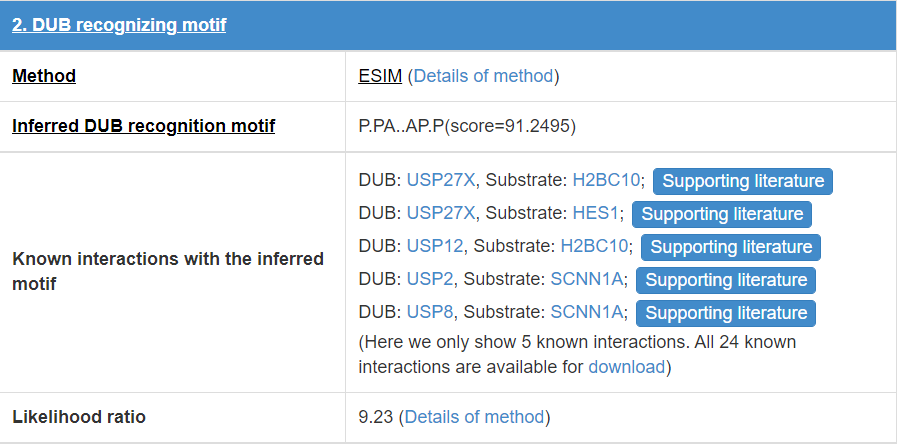
Figure 17. Table for E3/DUB recognizing motif
8.4 Network loops
E3 and substrate will form some network topology mode in the physical interaction network. We count the numbers of three-interaction loops and four-interaction loops.
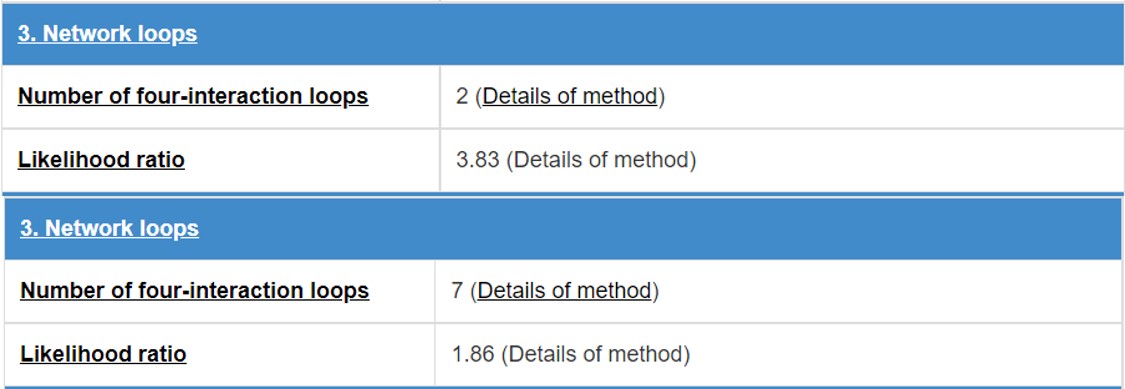
Figure 18. Table for network loops
8.5 Enriched GO pair
E3/DUB and substrate may have some functional association, so we calculate the GO annotation term pairs’ enrichment ratio between E3/DUB and substrate.
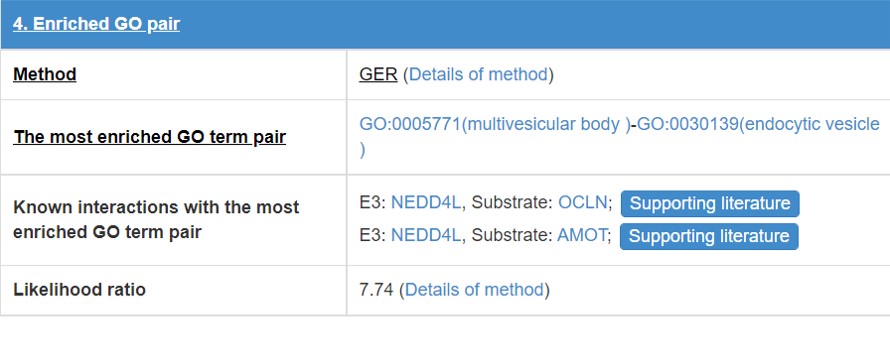
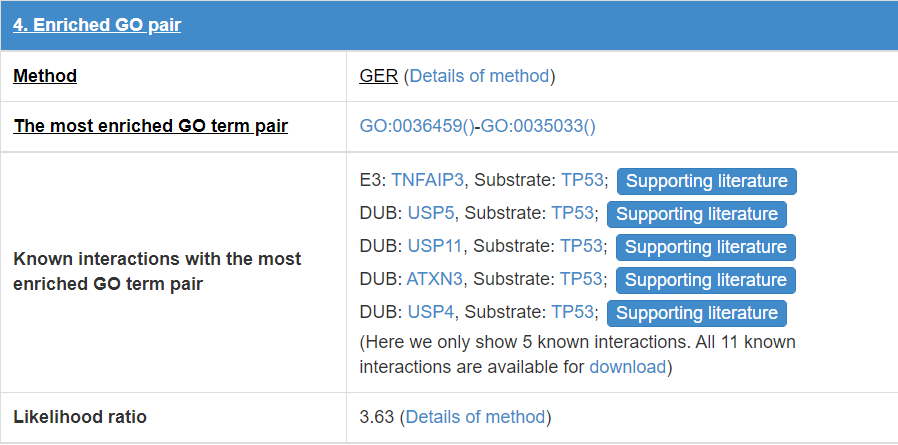
Figure 19. Table for enriched GO pair
*Detail of the method “Enrichment GO terms pair” of “DER”.
8.6 Sequence view of the E3/DUB-substrate interaction
In the popped sequence view, the literature reported ubiquitination/deubiquitination sites and predicted domains/motifs recognized by the corresponding E3/DUB are marked by multiple signs.
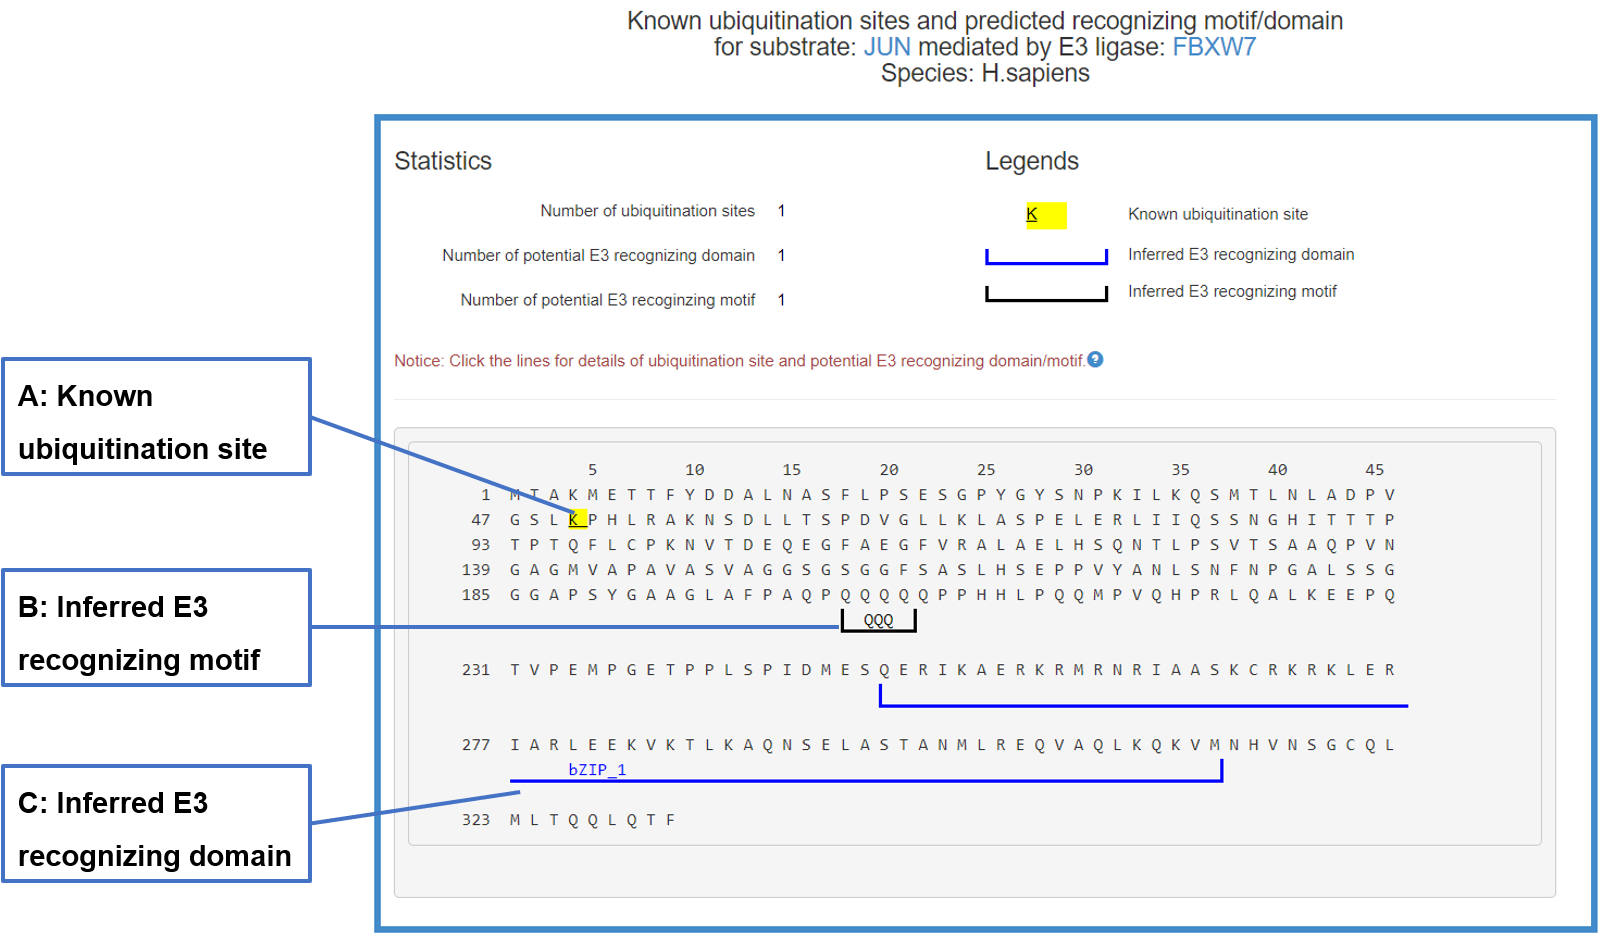
Figure 20-1. Sequence view of the E3-substrate interaction
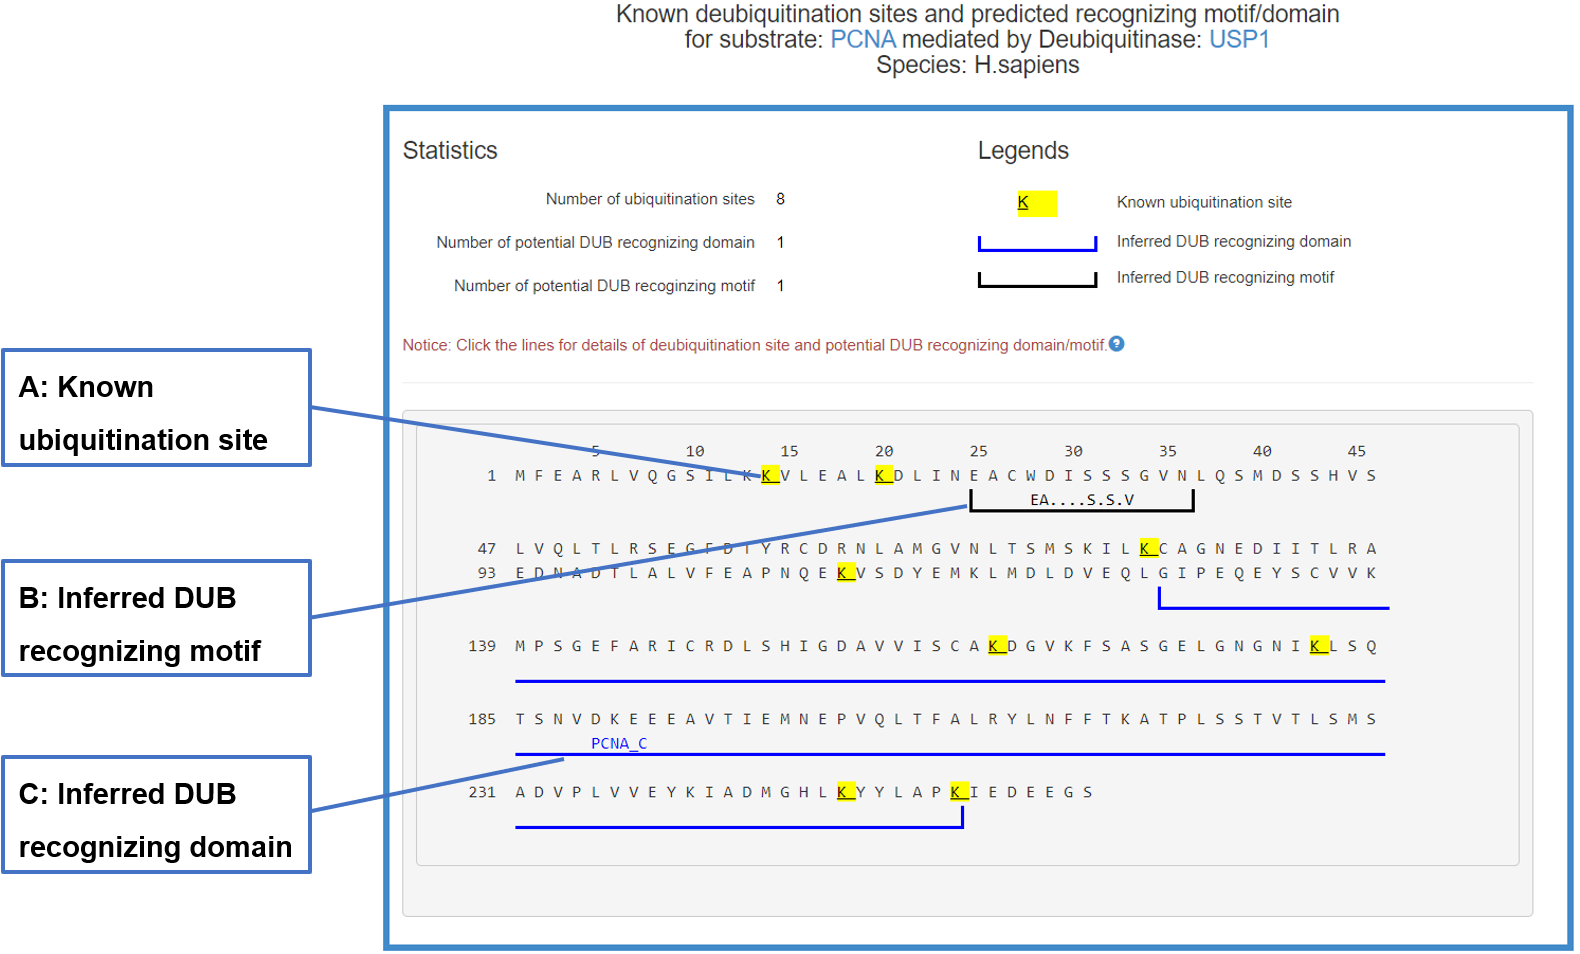
Figure 20-2. Sequence view of the DUB-substrate interaction
The substrate’s sequence is shown in PRIDE format with multiple signs: blue lines under the sequence denote the potential domain interacting with related E3/DUB, black lines under the sequence mark the inferred E3/DUB recognizing motif and the yellow background of character K means known ubiquitination/deubiquitination site. By clicking all these signs you can get more information.
8.6.1 Info box for known ubiquitination site
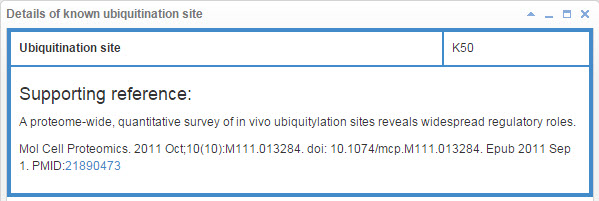
Figure 21. Info box for known ubiquitination site
8.6.2 Info box for inferred E3/DUB recognizing domain
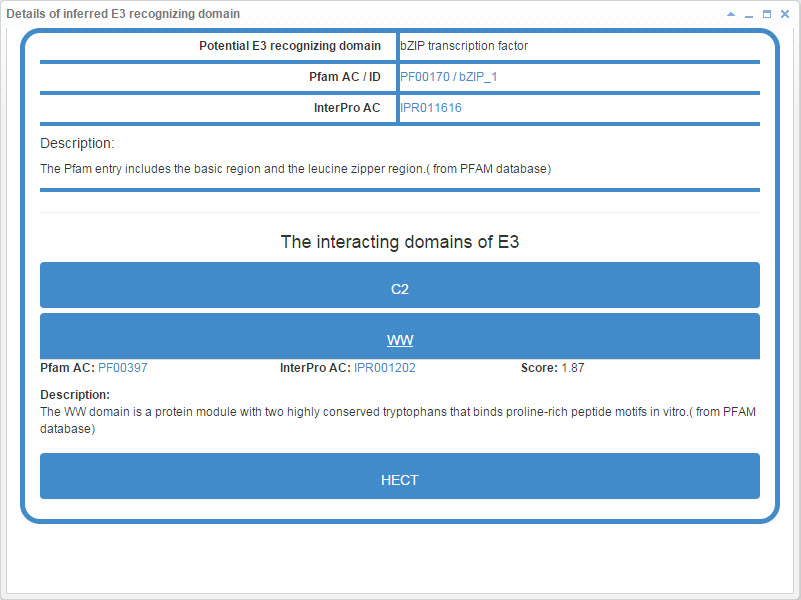
Figure 22-1. Info box for inferred E3 recognizing domain
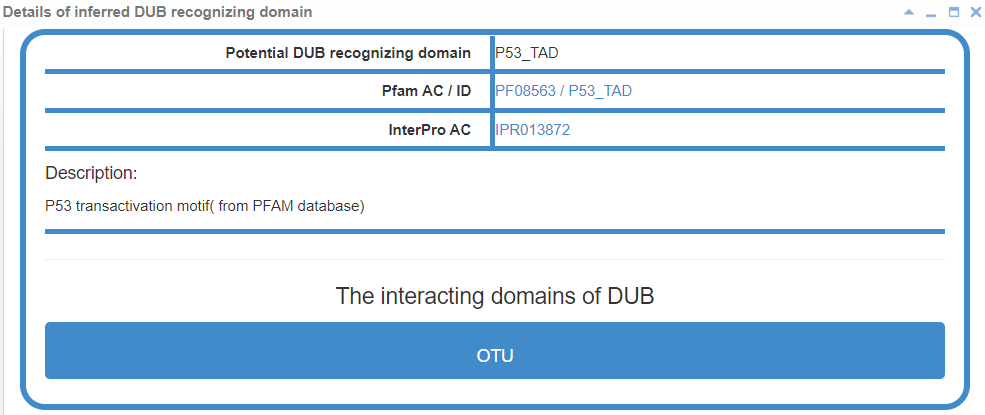
Figure 22-2. Info box for inferred DUB recognizing domain
8.6.3 Info box for inferred E3/DUB recognizing motif
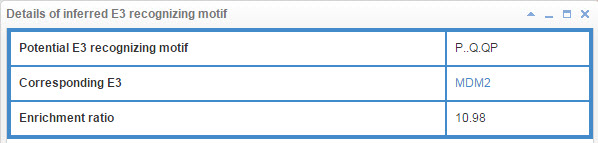
Figure 23-1. Info box for inferred E3 recognizing motif
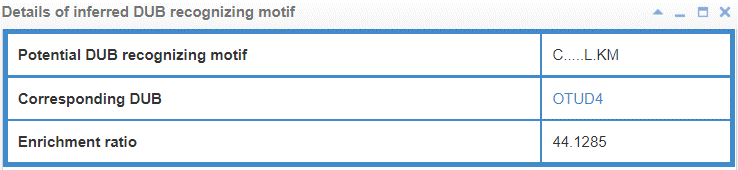
Figure 23-2. Info box for inferred DUB recognizing motif
9 Multi-species expansion
In order to provide friendly support to researchers in more fields and to compare cross-species ubiquitination modification systems, we expanded E3/DUB-substrate interactions to 39 eukaryotic species. First, the homology relationship between 38 species and human proteins was obtained from the inparanoid database. Then directly homologous the prediction evidence of human E3/DUB-substrate interactions to other species, use the homology evidence to score again, and predict E3/DUB-substrate interactions for each species.

Figure 24. 39 eukaryotic species
10 Nomenclature in UbiBrowser 2.0
10.1 Confidence score
The confidence score is computed as:
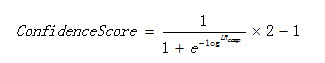
Equation 1
Where LR is the composed likelihood ratio.
10.2 Likelihood ratio
The Likelihood ratio of biological evidence f is the ratio of the probability of meeting condition f of interacting E3/DUB-substrate pair and non-interacting E3/DUB-substrate pair in the golden standard data sets. The Likelihood ratio is computed as:
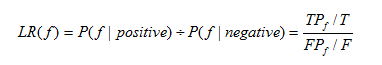
Equation 2
Where T and F are the number of all the true and false interactions respectively, TP and FP are the number of true and false interactions with the biological evidence f respectively.
10.3 Source database
The interaction databases recording this E3/DUB-substrate interactions.
10.4 Method
Distinct assessment method for one biological evidence.
10.5 DER
DER is shortness for Domain enrichment ratio.
10.6 Most enriched domain pair
The domain pair with the highest enrichment ratio.
10.7 Inferred E3/DUB recognizing motif
Motif extracted from the golden positive datasets. the different characters represent different amino acids and "." represent any amino acids.
10.8 ESMD
Shortness for E3/DUB-substrate recognizing motif.
10.9 Number of four-interaction loops
Number of four-interaction loops that an E3-substrate interaction is involved in.
10.10 GER
GER is shortness for GO pair enrichment ratio
10.11 Most enriched GO pair
The GO term pair with the highest enrichment ratio.
11 Methods
11.1 Golden standard datasets
To evaluate each biological evidence, the golden standard positive and negative data sets are constructed. 1322 E3-substrate interactions and 495 DUB-substrate interactions were manually extracted from the literature downloaded from PubMed. These data were used as golden standard positive (GSP) dataset. The GSN (golden standard negative) dataset was defined as the randomly combination of human E3s/DUBs and other human proteins, removing the overlap with GSP. Human E3 data was collected from UUCD (version 1.0).
11.2 E3/DUB-substrate enriched domain pairs
Considering that E3/DUB-substrate interactions are mediated by the interacting protein domains, we think that novel E3/DUB-substrate interactions may be predicted by identifying pairs of domains enriched among known E3/DUB-substrate interactions. Protein domain and family assignments were downloaded from Pfam (Released version 27). In total, 45019 assignments of 5487 protein domains and families to one or more of 18312 proteins were queried. Domain pair enrichment was assessed with the domain enrichment ratio (DER), which is calculated as the probability (Pr) of observing a pair of domain in a set of known E3/DUB-substrate interactions divided by the product of probabilities of observing each domain pair independently:
DER=Pr(d_e3/dub:d_sub |GSP)÷(Pr(d_e3/dub |GSP)×Pr(d_sub |GSP)) (1)
where d_e3/dub is domain of E3/DUB and d_sub is domain of substrate. d_e3/dub:d_sub is a E3/DUB-substrate interaction in which E3/DUB has d_e3/dub and substrate has d_sub, and GSP is a gold standard positive set of known E3/DUB-substrate interaction.
We used two thirds of the GSP to define enriched domain pairs and the remaining third to calculate the likelihood ratios. We repeated this process three times and combined these results. We found that the degree of domain enrichment in two thirds of GSP is strongly associated with the likelihood ratio calculated by the remaining third. (Figure 26A)
11.3 GO term enriched pairs
An E3/DUB and a protein that function in the same biological process, location in the same subcellular should be more likely to interact. To test this suppose, we calculated the GO term enrichment ratio (GER). The calculation is similar to E3/DUB substrate enrichment ratio. GO annotation data was downloaded from Gene Ontology Consortium (http://geneontology.org Released November 27, 2014 ). Finally we found the degree of GO term enrichment is also strongly associated with the likelihood ratio. (Figure 26B)
11.4 Network topology structure
To identify the E3-substrate interactions with certain network topology, we combine the query interaction with the HPRD protein interaction data to generate an integrated network for explanatory variables correlating with their confidences. We define N4 as the number of the four-interaction loops. (Figure 26C)
11.5 E3/DUB substrate recognizing motif
E3/DUB may associate with the specific substrate by recognizing a short liner sequence motif.
For each E3/DUB in GSP, we predict its substrate recognizing motif based on two parallel sequence data sets: one is the sequence data of its substrates in GSP (target dataset) to build the motif, and the other is that of all the proteins interact with this E3/DUB in GSP (background dataset) for background probability calculations. The reference sequence of human proteome was downloaded from Uniprot (version: May 2013) and the protein interaction datasets from HPRD.
To build the motif from a set of protein sequences, we in turn define the center amino acid from 20 kinds of amino acids.The first step is to convert both the target and background datasets into position-weight matrices (target matrix and background matrix) of equal dimensions where each matrix contains information on the frequency of all residues at the six positions upstream and downstream of the center amino acid. Using the information encoded in these two matrices, a third matrix, the hyper geometric probability matrix, is created. Specifically, this matrix contains the probability of observing s or more occurrences of residue x at position j (taken from the target matrix), given a background probability P for residue x at position j (taken from the background matrix).
The second motif-building step of the algorithm is a greedy recursive search of the sequence space to identify highly correlated residue/position pairs with the lowest P values. Each recursive iteration identifies the most statistically significant residue/position pair meeting a defined hyper geometric probability threshold (in this study taken as P < 10−3) and occurrence threshold (which represents the minimal number of sequences in the target data set needed to match the residue/ position pair). When such a pair is found, the sequence spaces of the target and background matrices are reduced by retaining only those sequences containing the selected residue/position pair, and a new hypergeometric probability matrix is calculated. This recursive pruning procedure is repeated until no more statistically significant residue/position pairs that meet the occurrence threshold are detected. At this point the motif is identified by the tally of residue/position pairs selected during this step and the its confidence score is defined as the sum of -log(P).The next step of the algorithm involves set reduction of the target and background data sets by removing all of those sequences that match the motif identified in the motif-building step. The purpose of this step is to remove the effects of those peptides with identified motifs from confounding the search for other significant motifs. Thus, performing the sequential loop of motif building is followed by set reduction results in a decomposition of the target sequence database into a list of significant motifs. The algorithm is complete when the motif-building step fails to identify any significant residue/position pairs. Finally, we assign another center amino acids and repeat the 3 steps above until all 20 types of amino acids are used as the center amino.
In total, 4050 E3/DUB potential recognition consensus motifs with score > 6.9 were identified, and we found these motifs are of certain prediction power for new ESIs/DSIs. (Figure 26D)
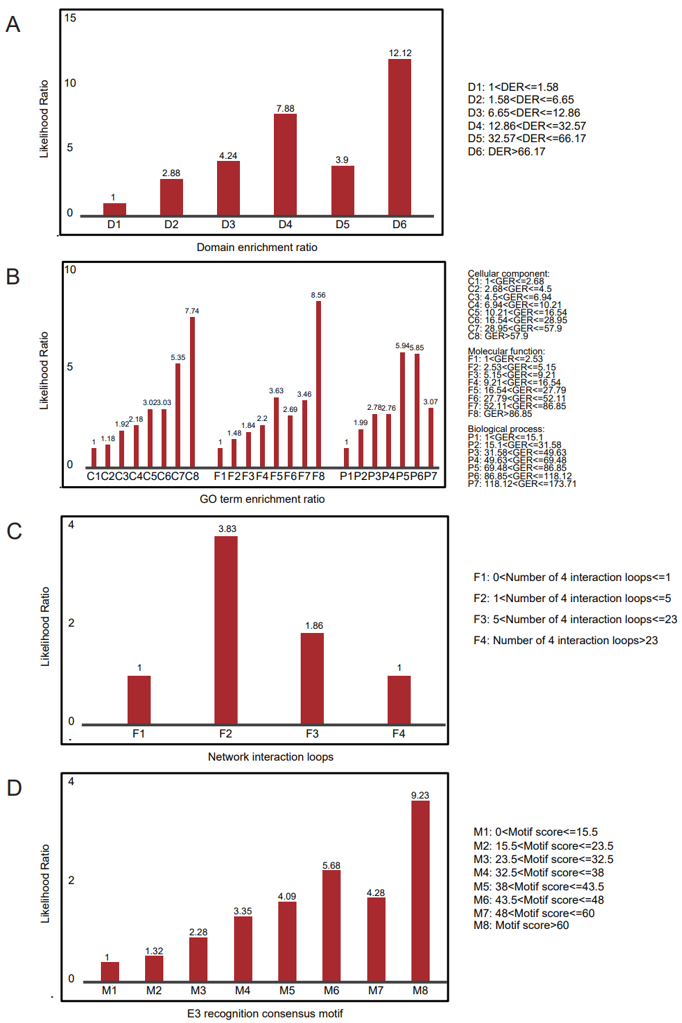
Figure 25. Diverse types of biological evidences contributing to the reliable evaluation
12 Download
12.1 Download known E3/DUB-substrate interactions
Filename: literature.E3/DUB.txt (e.g. literature.E3.txt)
Columns:
NUMBER: Serial numberSwissProt ID (E3/DUB): SwissProt ID of E3/DUB
SwissProt ID (Substrate): SwissProt ID of substrate
SwissProt AC (E3/DUB): SwissProt AC of E3/DUB
SwissProt AC (Substrate): SwissProt AC of substrate
Gene Symbol (E3/DUB): Gene Symbol of E3/DUB
Gene Symbol (Substrate): Gene Symbol of substrate SOURCE: Source of the supporting evidence SOURCEID: Source ID of the supporting evidence (PubMed ID/SwissProt ID) SENTENCE: Supporting sentences E3TYPE: Family type of E3/DUB COUNT: Number of the supporting evidence type: Type of the known E3/DUB-substrate interaction (Training data/Other) species: Specie of the known E3/DUB-substrate interaction
12.2 Download predicted proteome-wide data for specific species